
Restaurants advertise on Zomato to attract new customers. Until 2016, Zomato didn’t disclose advertising metrics to restaurant owners. Standard metrics include ad impressions, ad clicks, and click through rates (CTR).
The challenge in this project was to disclose these metrics and build Zomato’s first ever ad performance dashboard. Disclosing ad metrics was important to preserve transparency of the platform and build trust with our restaurant partners. We worked closely with the data analytics team, the Sales team, and our co-founders to build a clear and concise dashboard that reflects ad performance.
Building an ad performance dashboard meant understanding which metrics matter and demonstrate a return on investment (ROI).
Why restaurants advertise
We spoke to 15+ Zomato restaurant owners across Delhi, Dubai, and Melbourne to understand how they spend their marketing budgets. We learned why they advertise and what matters to them. The merchants we spoke to could be divided into the category of restaurant they own (nightlife, dark kitchen, casual dining, and so on), and their advertising motive.
The golden metric
The single metric that matters to a restaurant owner is revenue. Advertising is used to publicize the restaurant, get new customers, and thus increase revenue.
As a platform, Zomato can track the number of users who clicked on the ad. We do not know exactly how many people visited, but we can show the number of people it reached.
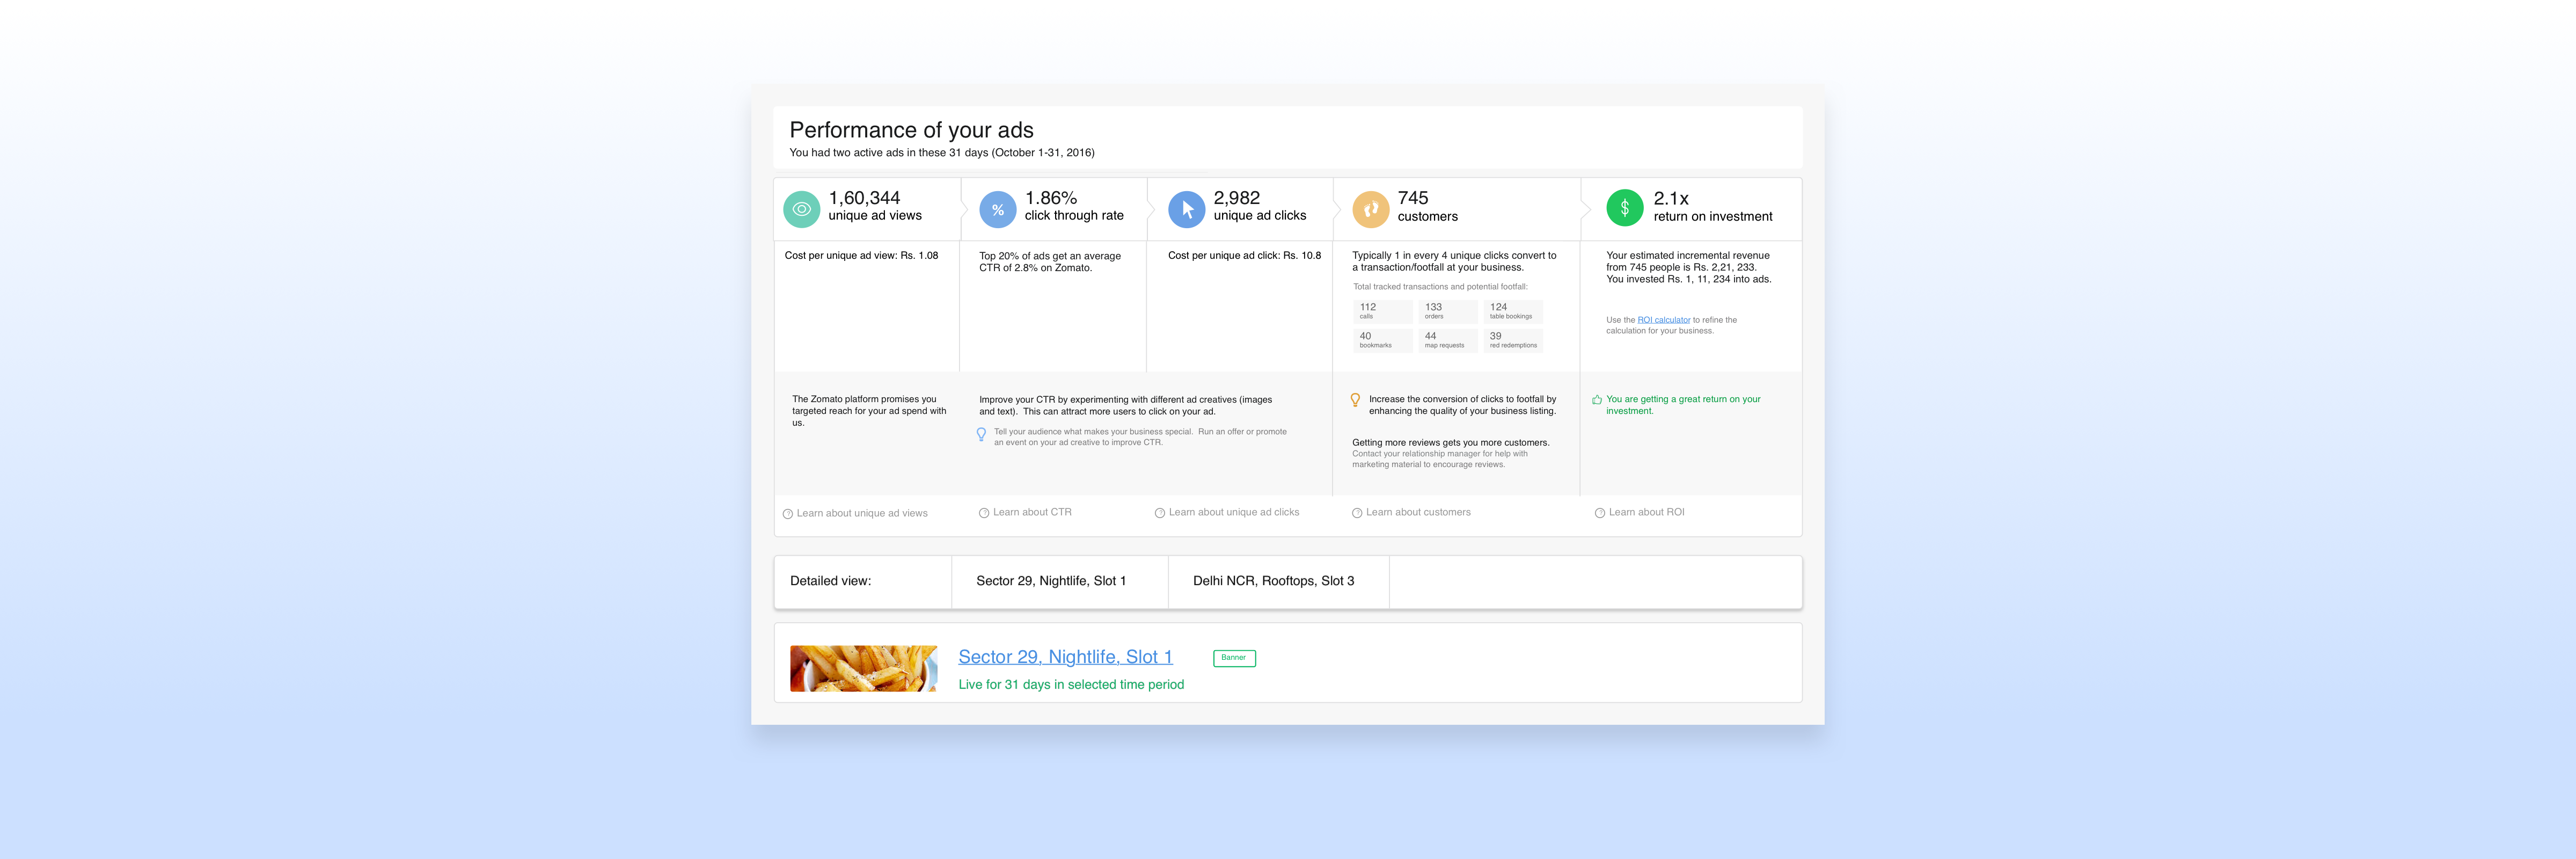
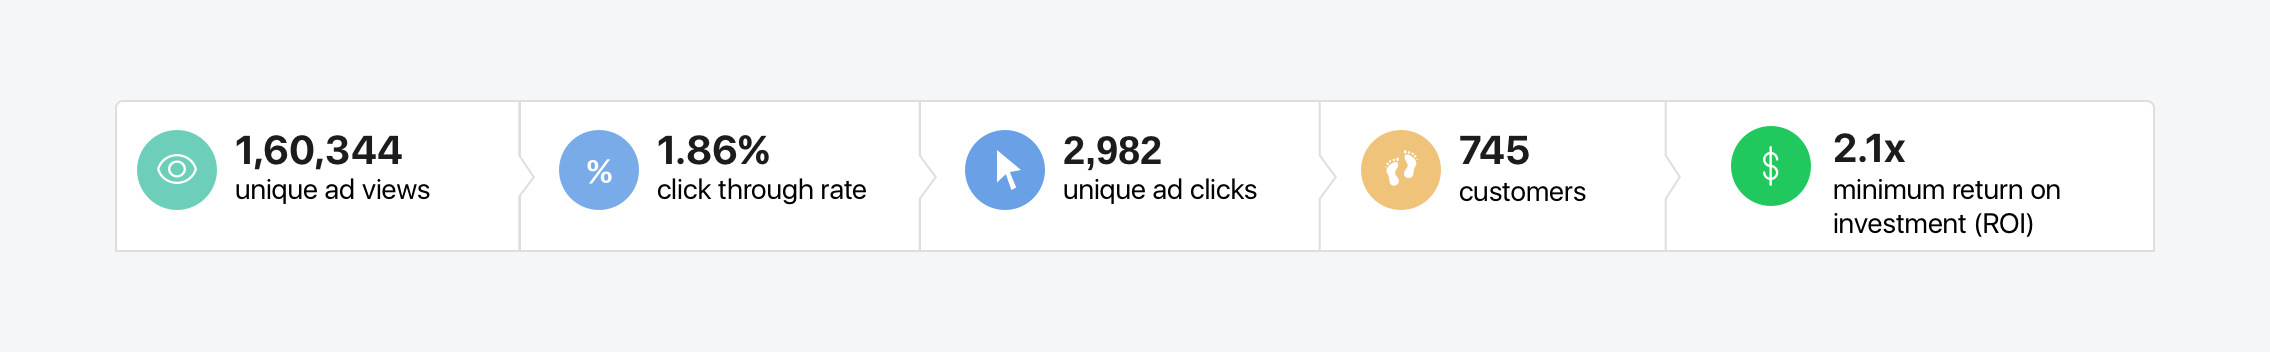
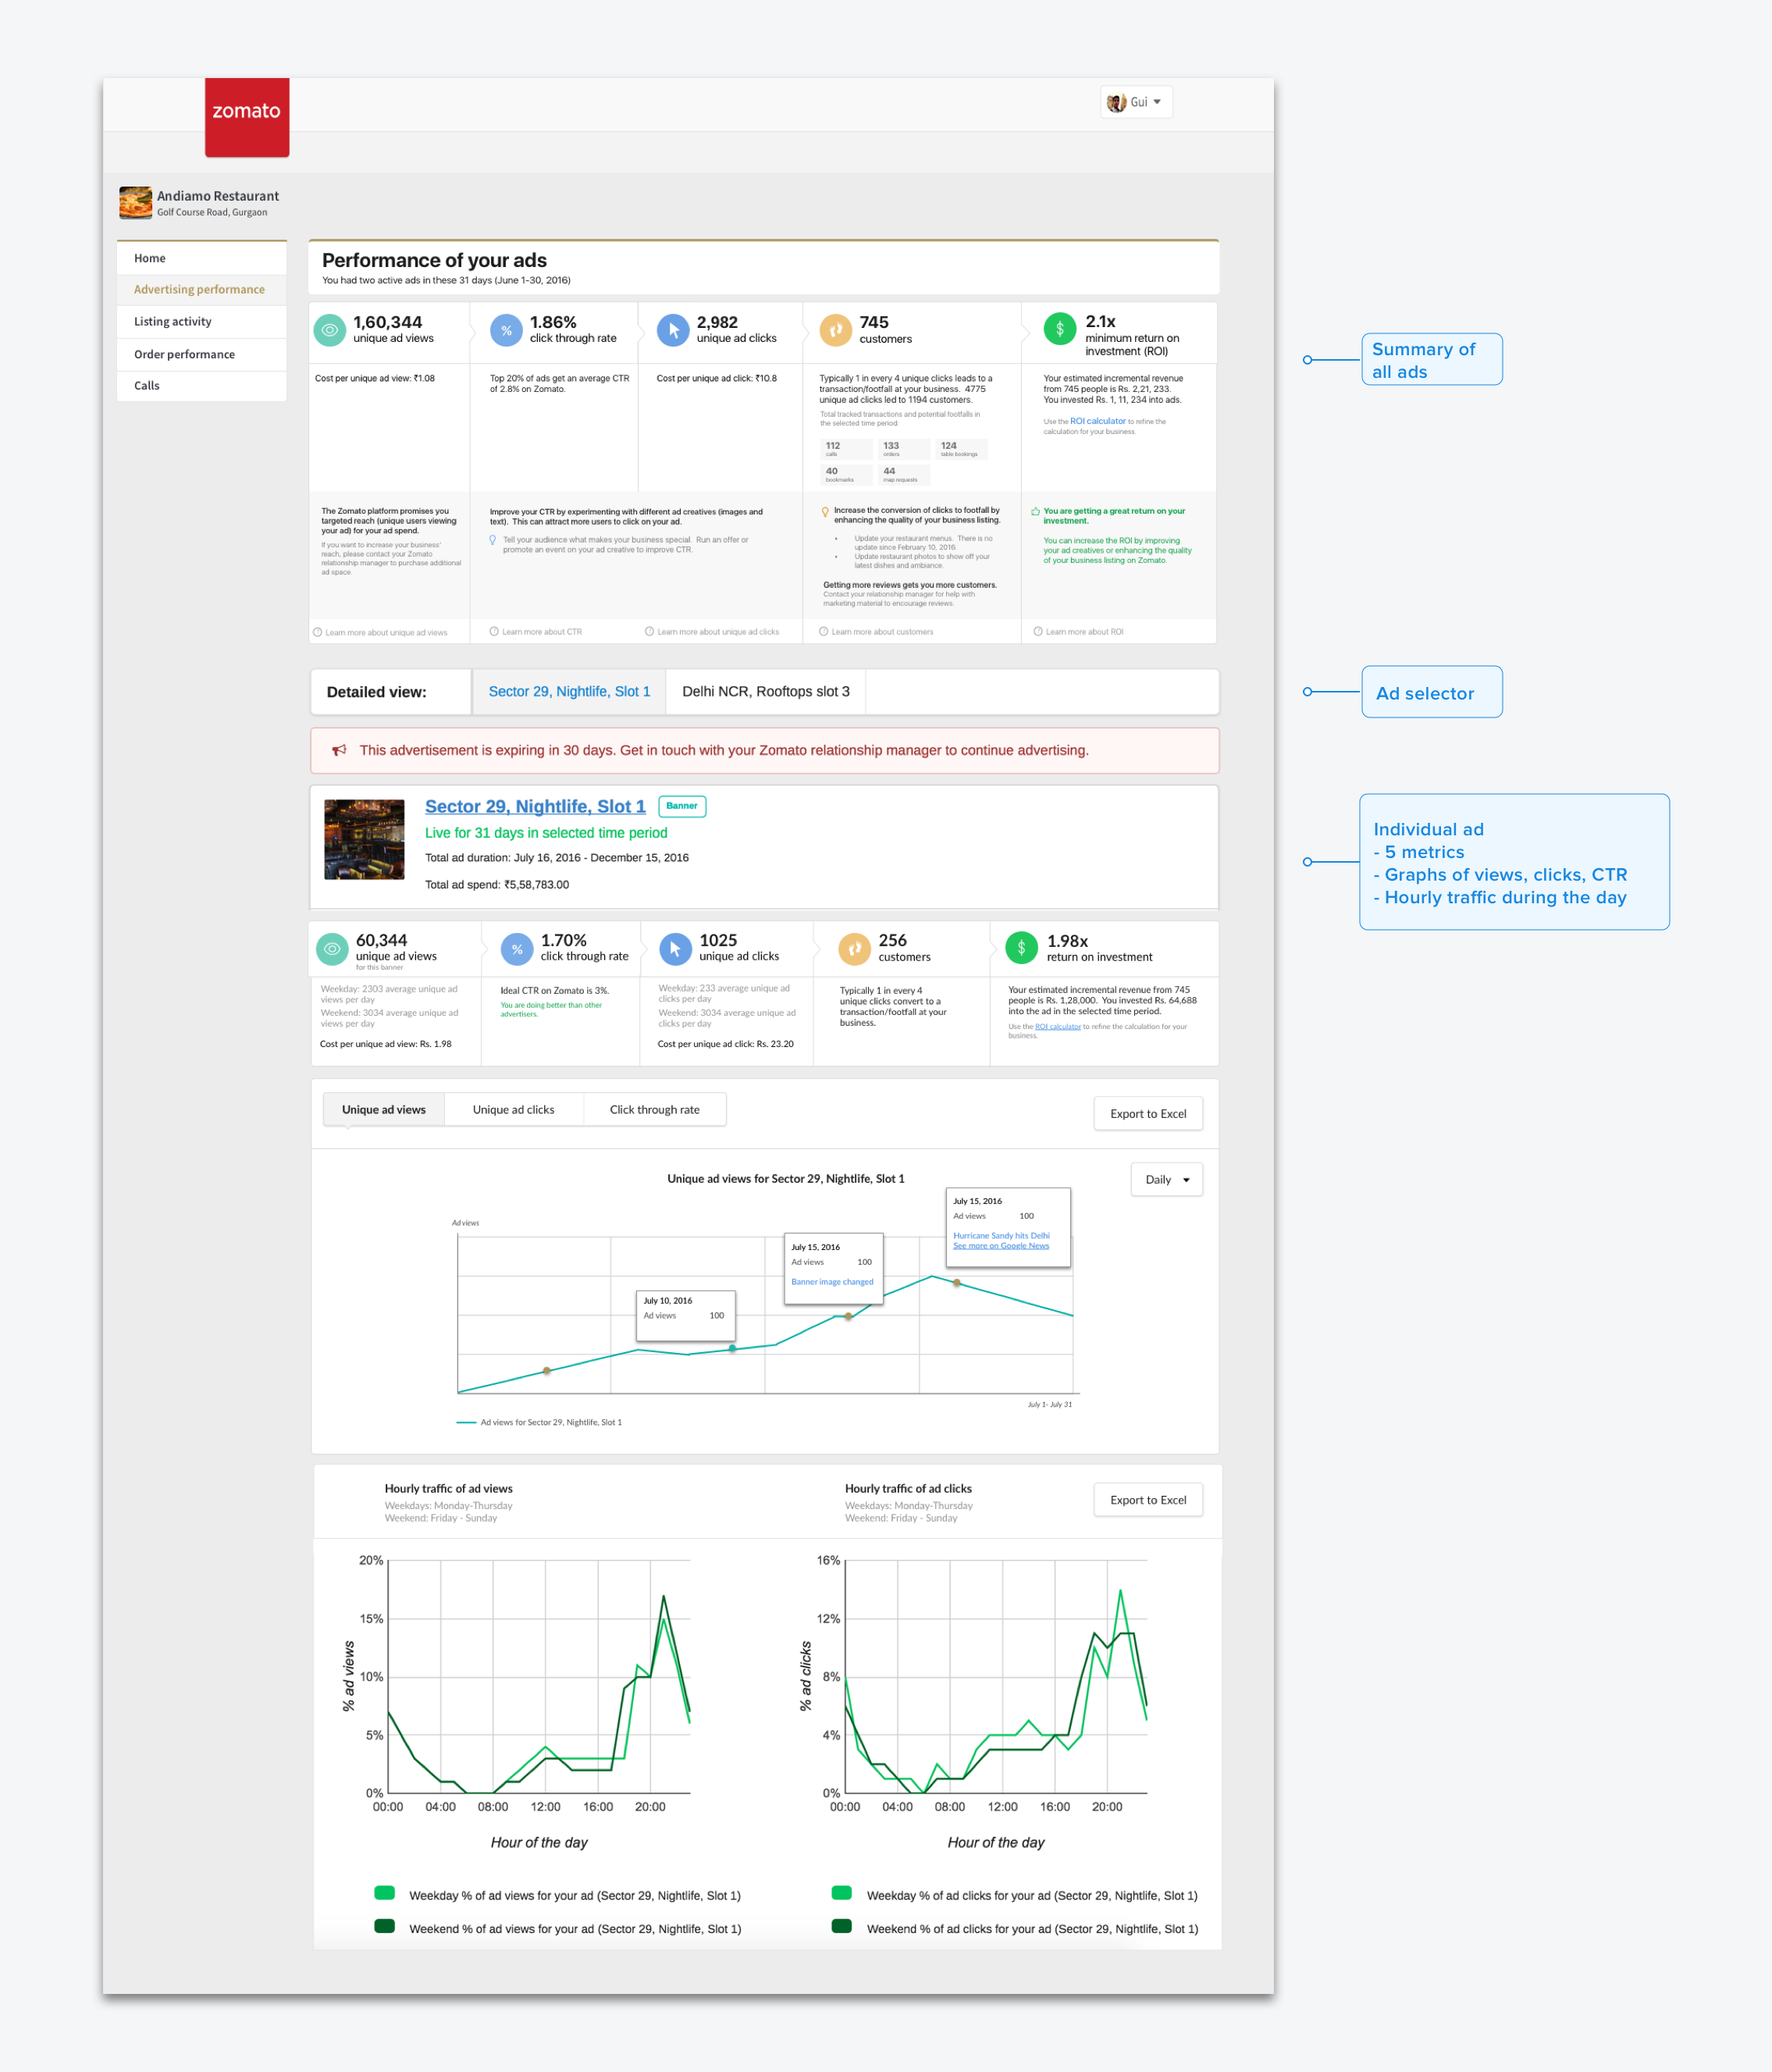
We show five metrics on the ad performance dashboard:
Other platforms
We studied the Facebook and Google ad platforms. We noticed that Facebook played on its strengths as a social platform - measuring ad results in terms of impressions, likes, and shares. Google played on its strengths as the world’s biggest search platform - focusing on impressions and clicks. Both showed a measurement of ROI that displays the advantage of their platform.
This helped us understand that we should leverage the strengths of the Zomato platform too. Zomato is a platform dedicated to foodies, people who are looking to eat. Each person who clicks on an ad has a high intent to eat. We had to demonstrate this intent clearly on the dashboard.
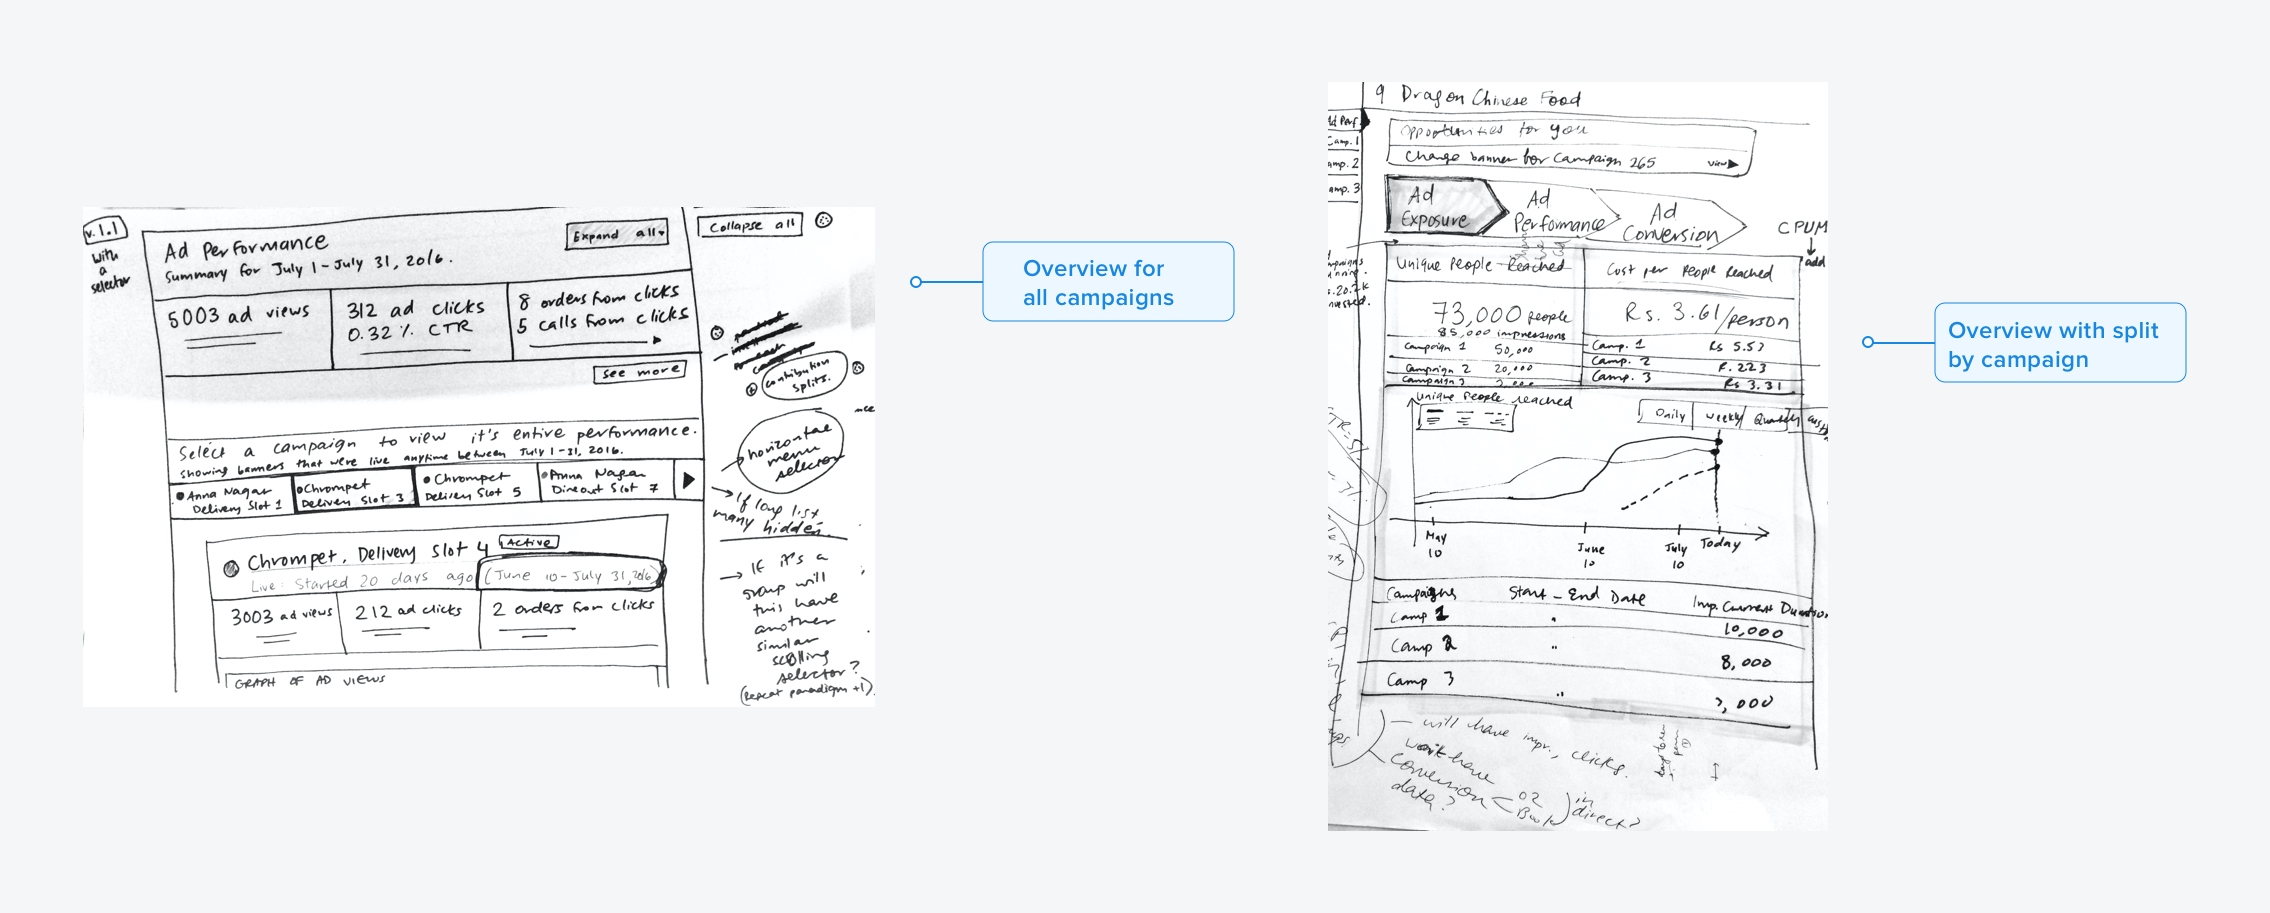
This is one of the most extensive wireframing exercises I’ve done! We stayed on paper and Balsamiq for about 3 months. Along the way, the business clarity on this project was also evolving as we looked at ad performance results by ad type, market, and cost. The trends we were seeing affected the flow and portray of the information on the dashboard. As we became more confident in data patterns, our design reached a consensus.
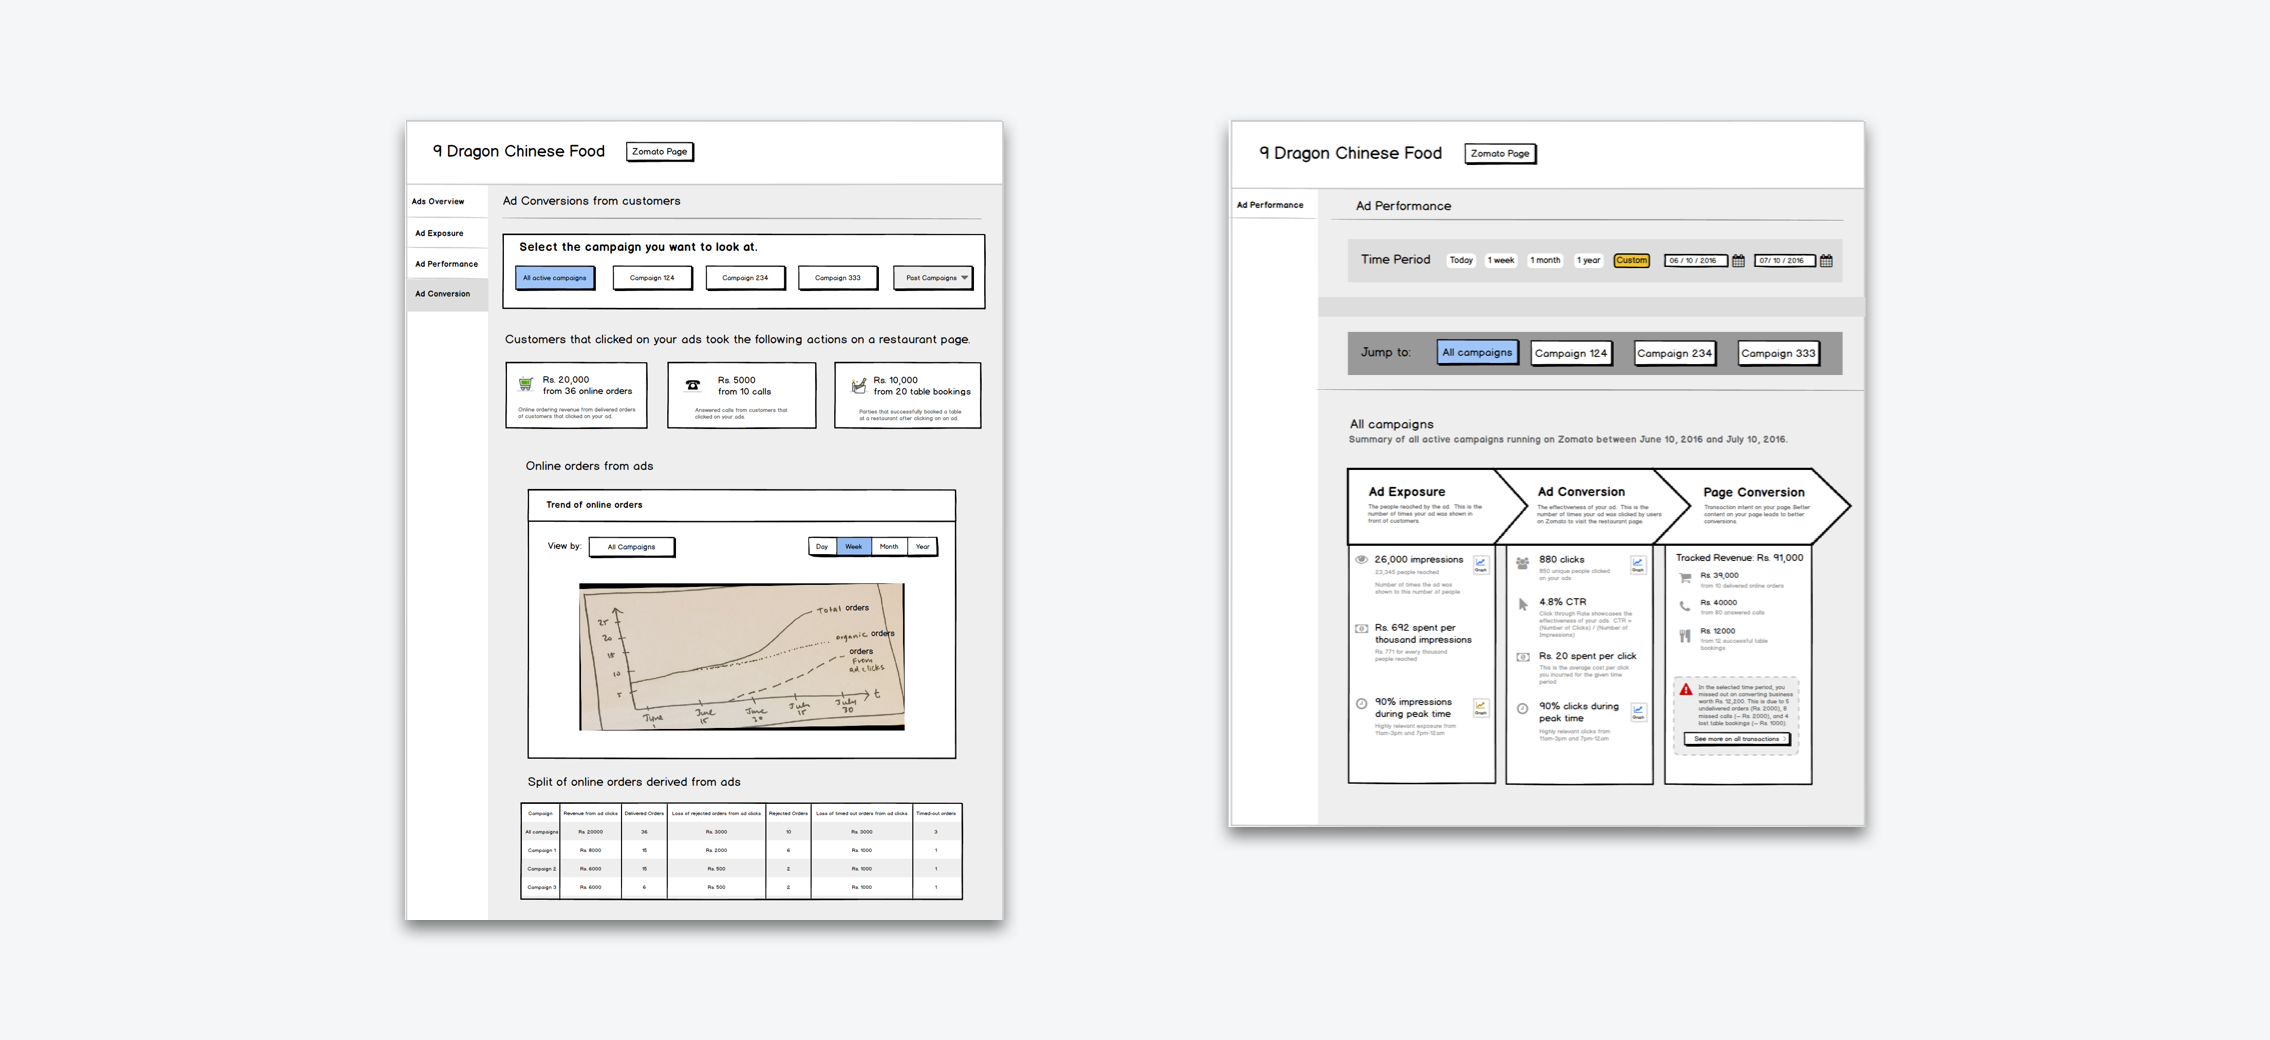
The page is divided into three parts.
Usability testing
Handling edge cases
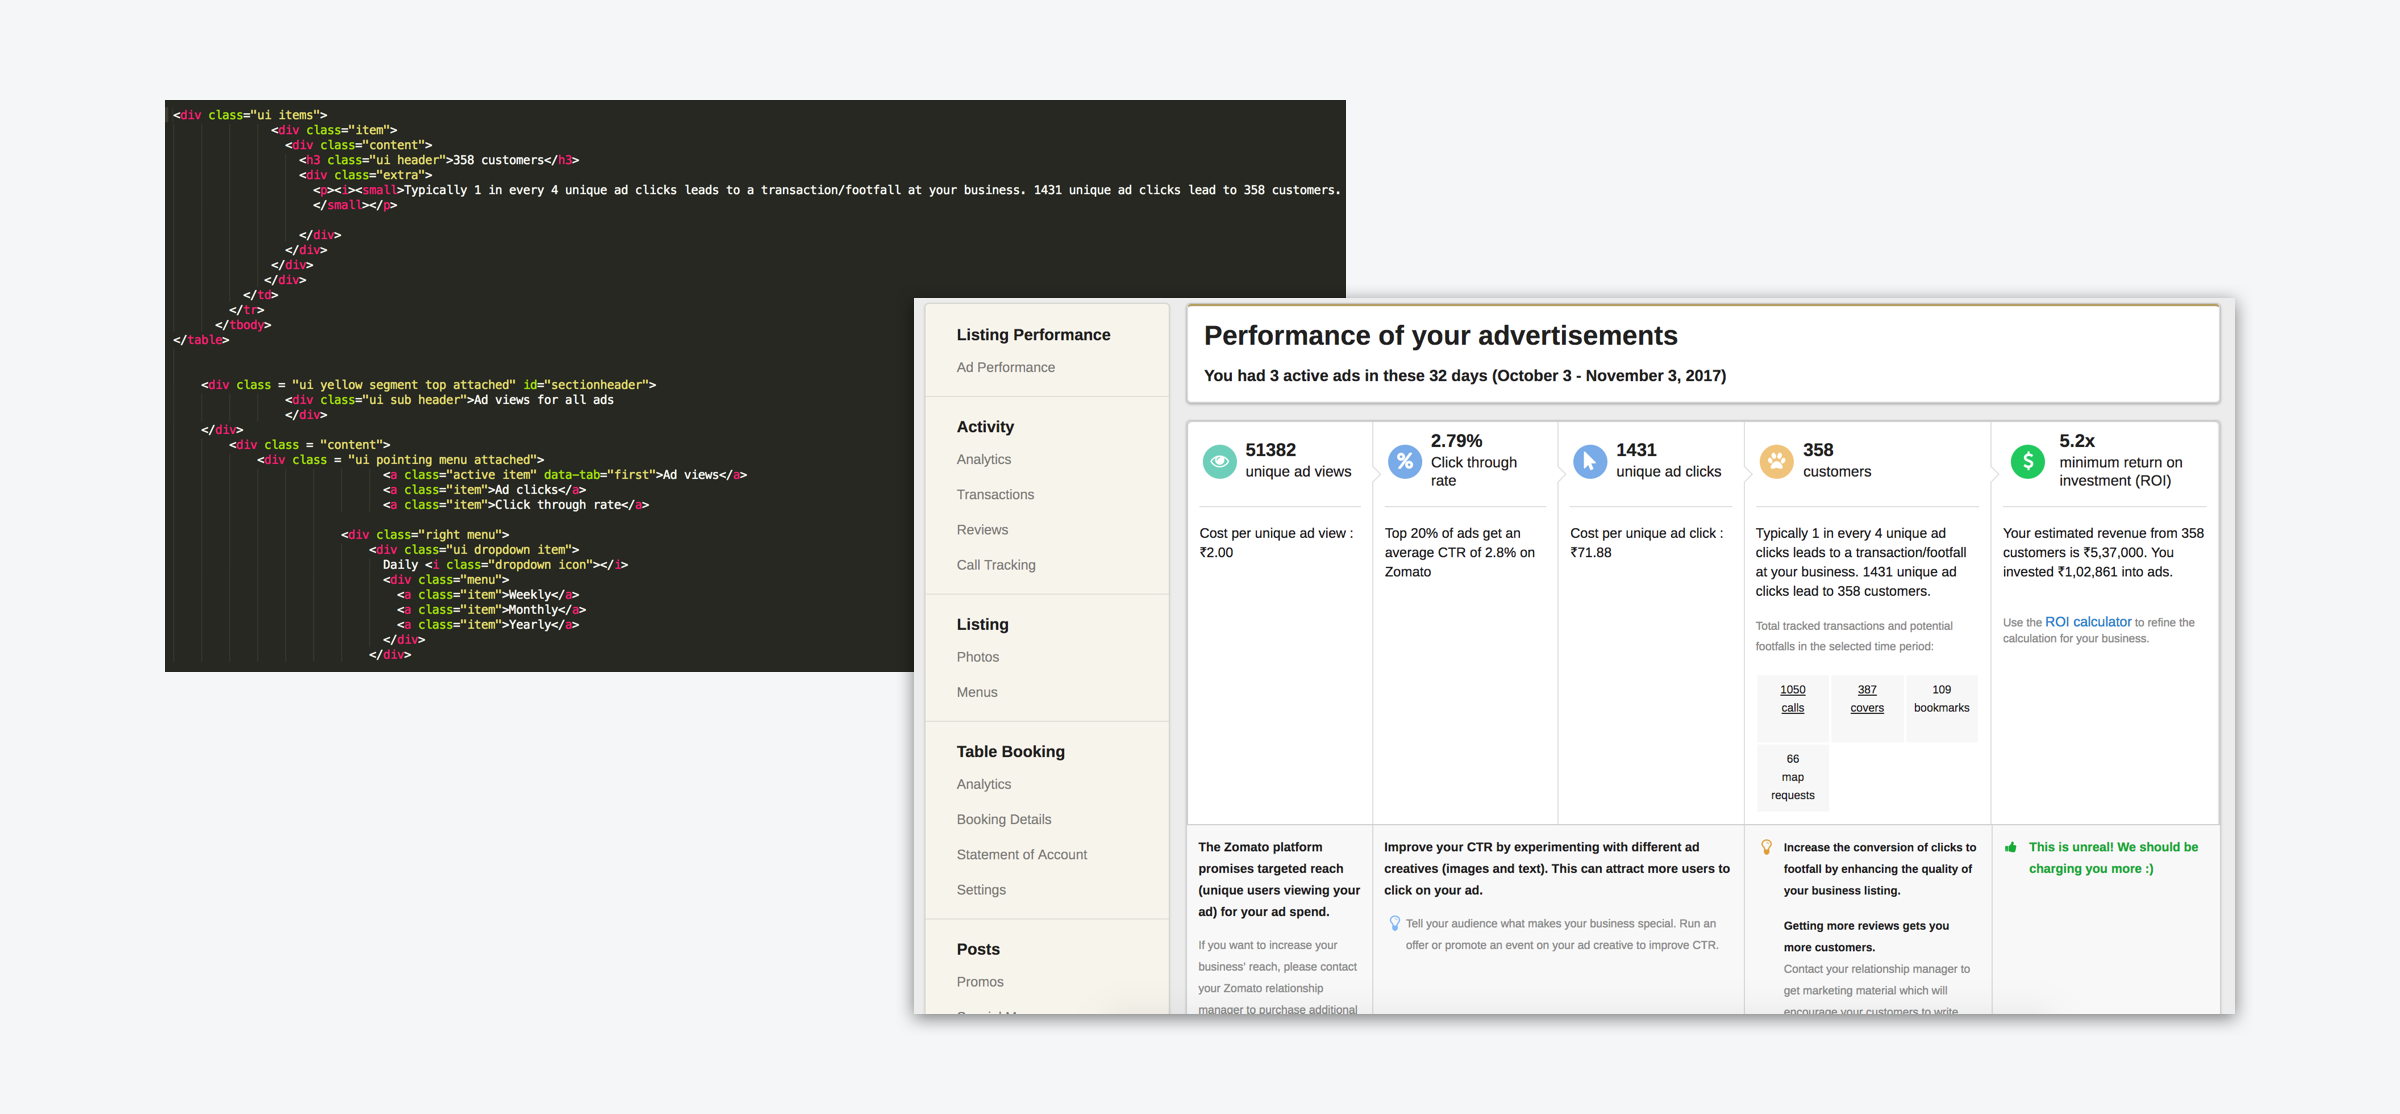
Prototyping in code
The tech team uses Semantic UI as the front-end UI framework on the web. I started to directly prototype in Semantic UI with dummy data to model the future live version. I found it extremely helpful in user tests with our merchants - they could open FAQs in pop-ups, toggle different filers, and provide real-time feedback on what was working and what wasn’t.
Bonus: Writing in HTML, CSS, and Javascript got me back into the habit of prototyping with code. It was a nice way of quickly refining the mockup as we got closer to final design.
As the PM for this project, the final design had to be accompanied with specifications for the developers. I think the front-end prototype in code really helped the developers visualize the flow of information. We spent a lot of time covering edge cases — for different types of banners, life cycle of the ad, potential downtime of the DB, and more. We tested the product internally for 2 months before going live globally (translations to 7 languages included!).
From a business, logic, design, and revenue perspective, this is probably one of the hardest projects I’ve worked on. When 70% of the company’s revenue comes from ads, therein lies great responsibility to keep future income stable. Analyzing data, deciding what to risk and what to let go, and balancing transparency with protectionism was a big part of this project.
I think I learned a few hard lessons in managing stakeholders as well. Not all business units thought about ads the same way - business development worried about growth, Sales worried about renewals, co-founders wanted transparency and preservation of market share. Balancing their goals was a great challenge.
I learned it was important to: